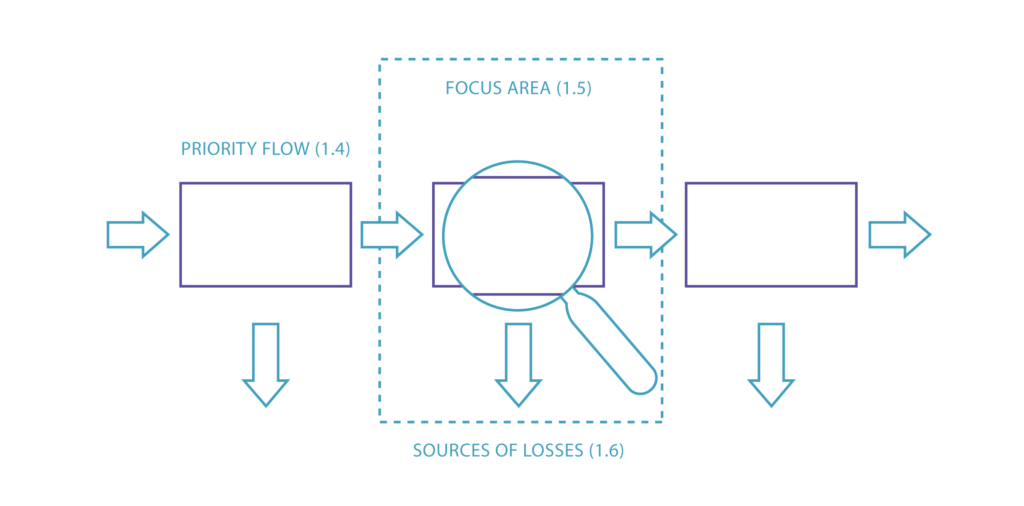
Step 1.5 Setting up focus areas
Which manufacturing processes and areas have the most significant share of NPO costs and the greatest potential for improving resource efficiency?
Rationale
Understanding which areas of a production system have the greatest potential for improving resource efficiency requires the distribution of the NPO data from the company system boundary to individual resource/energy users. The latter may be identified as cost centres and/or production lines or steps, depending on the complexity of the company. This process will lead to the identification of the focus areas for each of the priority flows identified in step 1.4, and to the further improvement of the company’s information system for the next business year.
For energy flows, the cost allocation process can be based on three different levels of accuracy depending on the existing information system:
- Energy consumption estimates based on nominal plate value of machines;
- Data collected during spot measurement campaigns;
- Real-time energy consumption from metering systems in place. Water consumption at specific processes can similarly be estimated or measured. As for the allocation of material losses, this can be more challenging considering that even companies with cost accounting and production planning systems in place may not have this kind of information in place for most material flows. Therefore, material losses at specific processes are often estimated in the first place and can be updated later if measurement campaigns are conducted.
This step will highlight the areas in the company (specific departments, production units, cost centres) that generate the most significant share of the total NPO costs. Benchmarking with international best available techniques or expert opinions can confirm whether specific areas with a high ratio of NPO costs also have significant potential for improvement and should be selected as focus areas. Note that another reason for deciding on a focus area is that it is a source of significant environmental and health risks – e.g. use of toxic substances. The chosen focus areas will be further analysed in step 1.6.
The TEST Team should define Operational Performance Indicators (OPIs) for the selected focus areas (e.g. energy use per unit of production at the drying stage). These OPIs are to be included in the information system on flows (a monitoring system for regular data measurement and survey of process resource efficiency described in chapter 3). Calculating and recording the baseline for OPIs at this stage enable future monitoring of performance, and validation of RECP improvements at the company site. Note that the KPIs set at the company boundary level for priority flows cannot be used for monitoring real savings associated with an RECP measure, as several measures may have contributed to the improvements in the use of a specific material or energy flow.
ACTION TABLE ►
INPUTS
- MFCA excel tool filled in at the company system boundary (worksheet 1) for the previous fiscal year
- Priority flows selected in step 1.4
- Company process flow chart, list of cost centers
- Material, water and energy balances at company level
- Objectives and KPIs defined at the company level
- International benchmarks for individual production processes in the specific industry sector (if available and applicable)
CORE ACTIVITIES
- Define production steps as operating cost centres (if cost centres are not already defined)
- Assign annual NPO costs (and volumes, if available) to identified cost centres/ production steps and complete MFCA tool worksheet 2.
- For energy flows, the energy mapping tool can be used
- Set up OPIs for cost centres/ processes with highest NPO costs
- Benchmark performance of specific processes/cost centres (use benchmarking data if available, otherwise use expert judgment)
- Select focus areas
- Calculate baselines for OPIs of selected focus areas Set up objectives for improvement at focus area level
OUTPUTS
- NPOs in money and, if available in volume, terms assigned to main production steps (cost centres)
- Inconsistencies identified in company information systems, and recommendations elaborated for better data monitoring
- Savings potential developed for areas with high NPO costs Focus areas selected and related to priority flows OPIs related to focus areas
- Baselines for OPIs and reference to international best practices and benchmarks
TIPS ►
- Cost centres are well defined and used for allocating production costs in those companies that have a cost or management accounting system in place (specific departments, process units, or even machines). Often, different managers are responsible for different cost centres, and this requires facilitating teamwork during the MFCA data collection process.
- If a company does not have a cost accounting system in place, costs can be assigned to specific production steps or departments on the basis of the process flowchart. The ISO 14051 MFCA standard uses the term “quantity centre”, which can also be related to cost centres or production steps.
- Supportive cost centres can be established for utilities (e.g., water treatment, steam generation, compressed air, maintenance, environmental management). When cost accounting is in place it is possible to apportion the different utility costs to the production cost centres (end users).
- If data are missing, the best possible estimation should be made in addition to planning how to improve the data collection systems. Companies are recommended to invest in installation of sub-meters for energy and water at the priority areas/key consumers.
- If different people provide different figures during the analysis, the revealed data inconsistency can be presented as a learning opportunity for the company team. This fosters the need for understanding the real sources and causes of inefficiencies within the process.