Step 1.4 – identifying NPOs costs and the priority flows
What are the material and energy inputs/outputs associated with the highest economic losses and/or the most significant environmental impacts?
Rationale
The starting point of the TEST diagnosis focuses on the company system boundary (the boundary through which flows of materials, water and energy enter and/or leave a production system). Its aim is to identify the material and energy flows with the highest potential for resource efficiency improvement. These can then be selected as priority flows and analysed in more detail in steps 1.5 and 1.6.
Companies often do not realize that the actual costs of the waste and pollution which they generate are not just comprised of disposal fees, treatment and equipment costs, but they also include the costs of purchasing materials that are turned into waste or excess energy. These costs are called “non-product output” costs (NPO costs) and are, on average, one order of magnitude higher than the costs for waste disposal and emissions treatment. Managers do not realise this because actual NPO costs are rarely tracked by companies’ accounting systems. However, they can be calculated or estimated by accounting and production managers.
Priority flows are selected based on the following criteria:
Total economic loss due to the inefficient use of specific material, water or energy flows (NPO costs)
Potential for monetary and physical savings of material, water or energy (benchmarking is performed in order to estimate the magnitude of the realistically potential savings for specific flows)
The company’s own environmental concerns (legal requirements, scarcity of production inputs, health and safety issues, etc.)
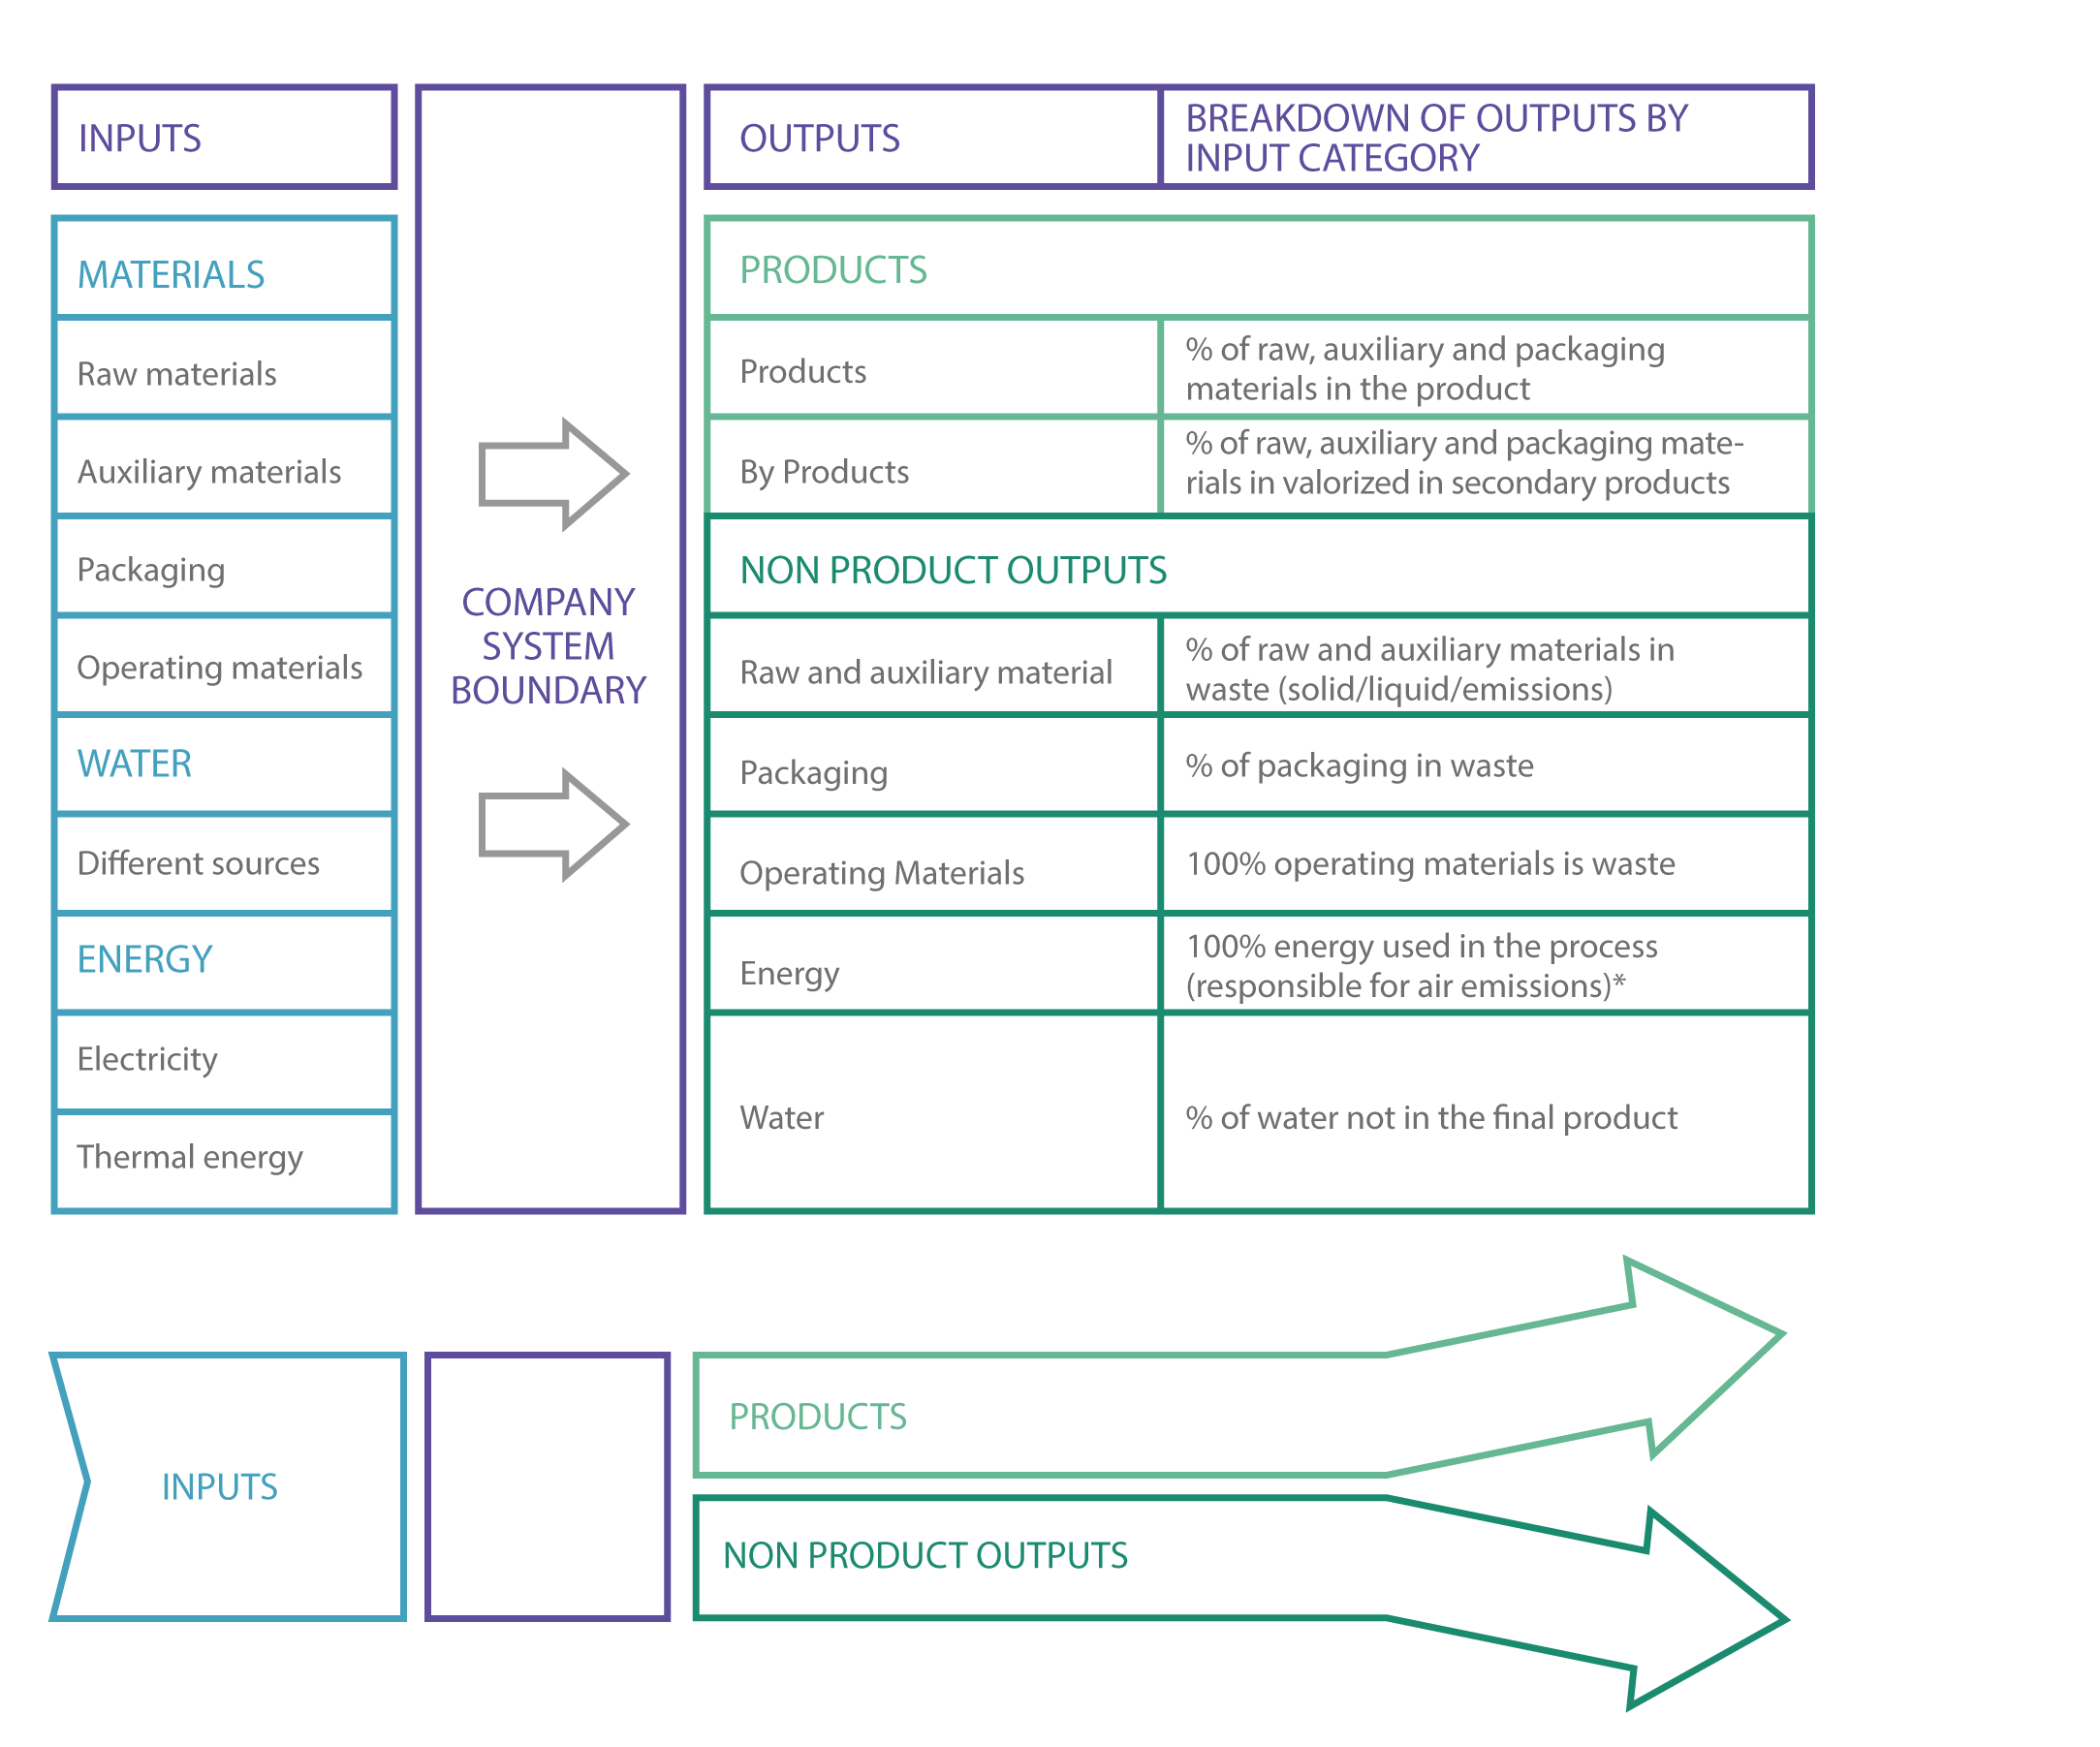
The calculation of NPO costs and quantities is normally based on data from material balances and the list of accounts, as many companies do not have more detailed information systems. The total inputs and outputs from the previous business year are collected in both volume and monetary value to complete the balance. Losses of inputs (materials, water and energy) and related costs are estimated. The material inputs are broken down into raw, auxiliary and packaging materials, which end up as products, waste or emissions (see input/output categories in figure below). Operating materials and energy, which by definition do not become (part of) products, are considered 100% NPO. The first input-output assessment generally does not balance out to zero, but the goal is to define the baseline of the total NPO costs and to record improvement options for the information system so there is better data available for the coming accounting periods.
As part of this step, the TEST Team can initiate the information system for resource efficiency for the selected priority flows, by:
- Setting up key performance indicators (KPIs) for each priority flow, for example, if water was identified as a priority flow the KPI can be the annual amount of water used per unit of production (m3/t)
- Calculating the baseline for the KPI (usually based on data from the previous year – e.g., the amount of water used per ton of production in the previous fiscal year)
- Formulating an objective for each priority flow (for example, increased water conservation) and setting up a specific target (e.g., % of increased water efficiency within a defined period)
It should be stressed that as soon as a flow is recognised as a priority flow, its resource efficiency performance should be regularly monitored if this is not yet being done.